Area Real Estate News & Market Trends

You’ll find our blog to be a wealth of information, covering everything from local market statistics and home values to community happenings. That’s because we care about the community and want to help you find your place in it. Please reach out if you have any questions at all. We’d love to talk with you!

July 1, 2026

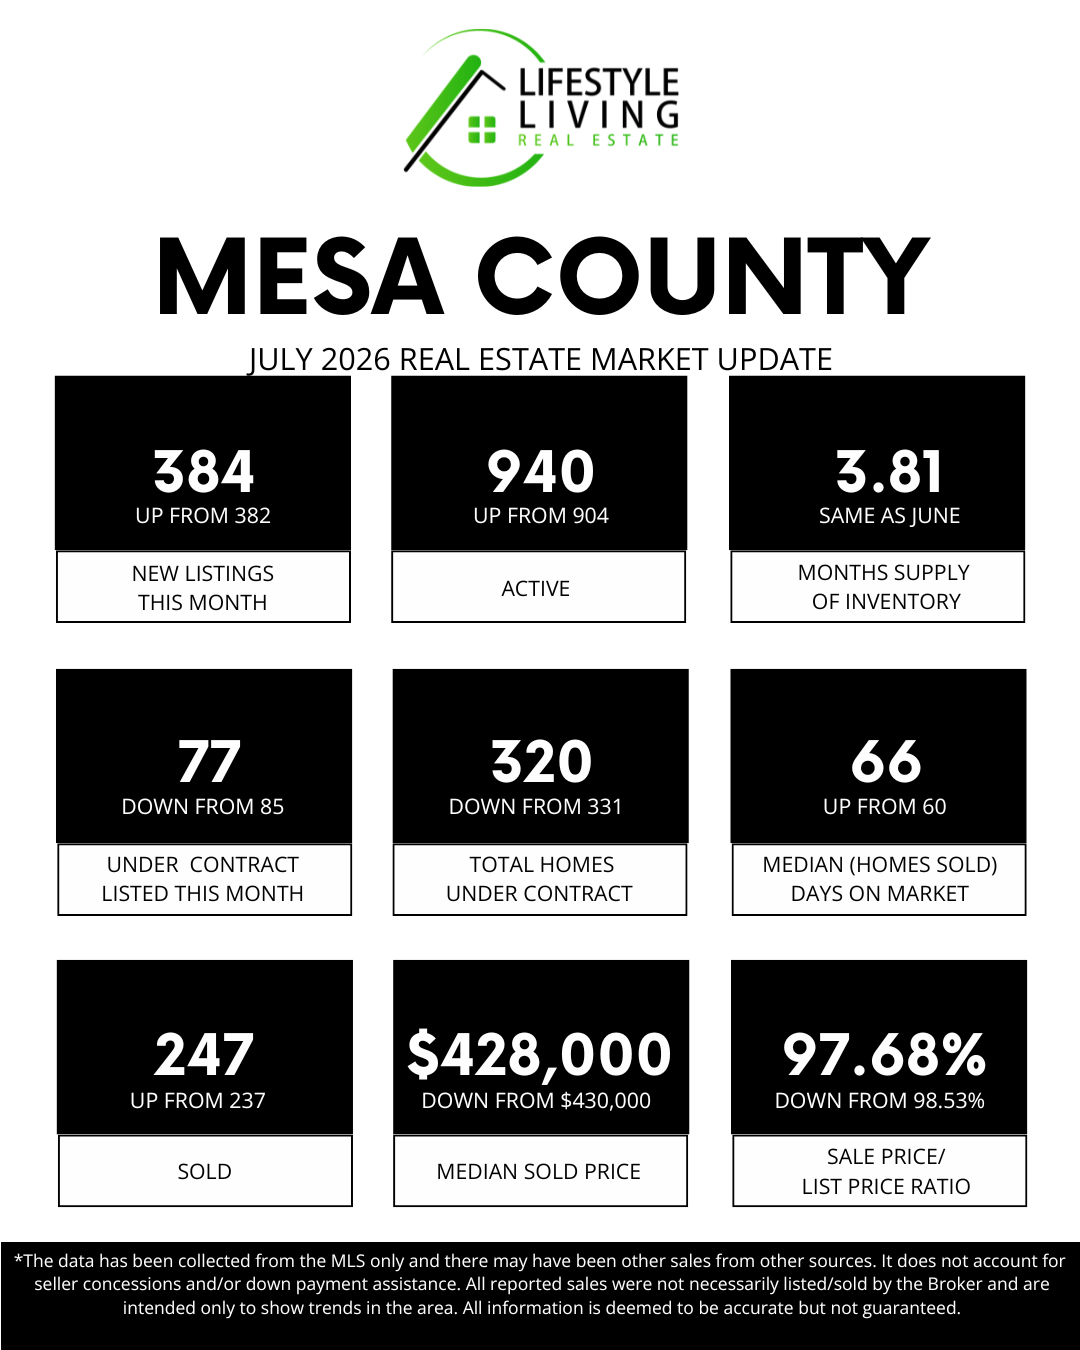
June 2026 Market Report: Mesa County Real Estate Insights


📊​June Market Trends: Your Guide to Local Real Estate 🏡


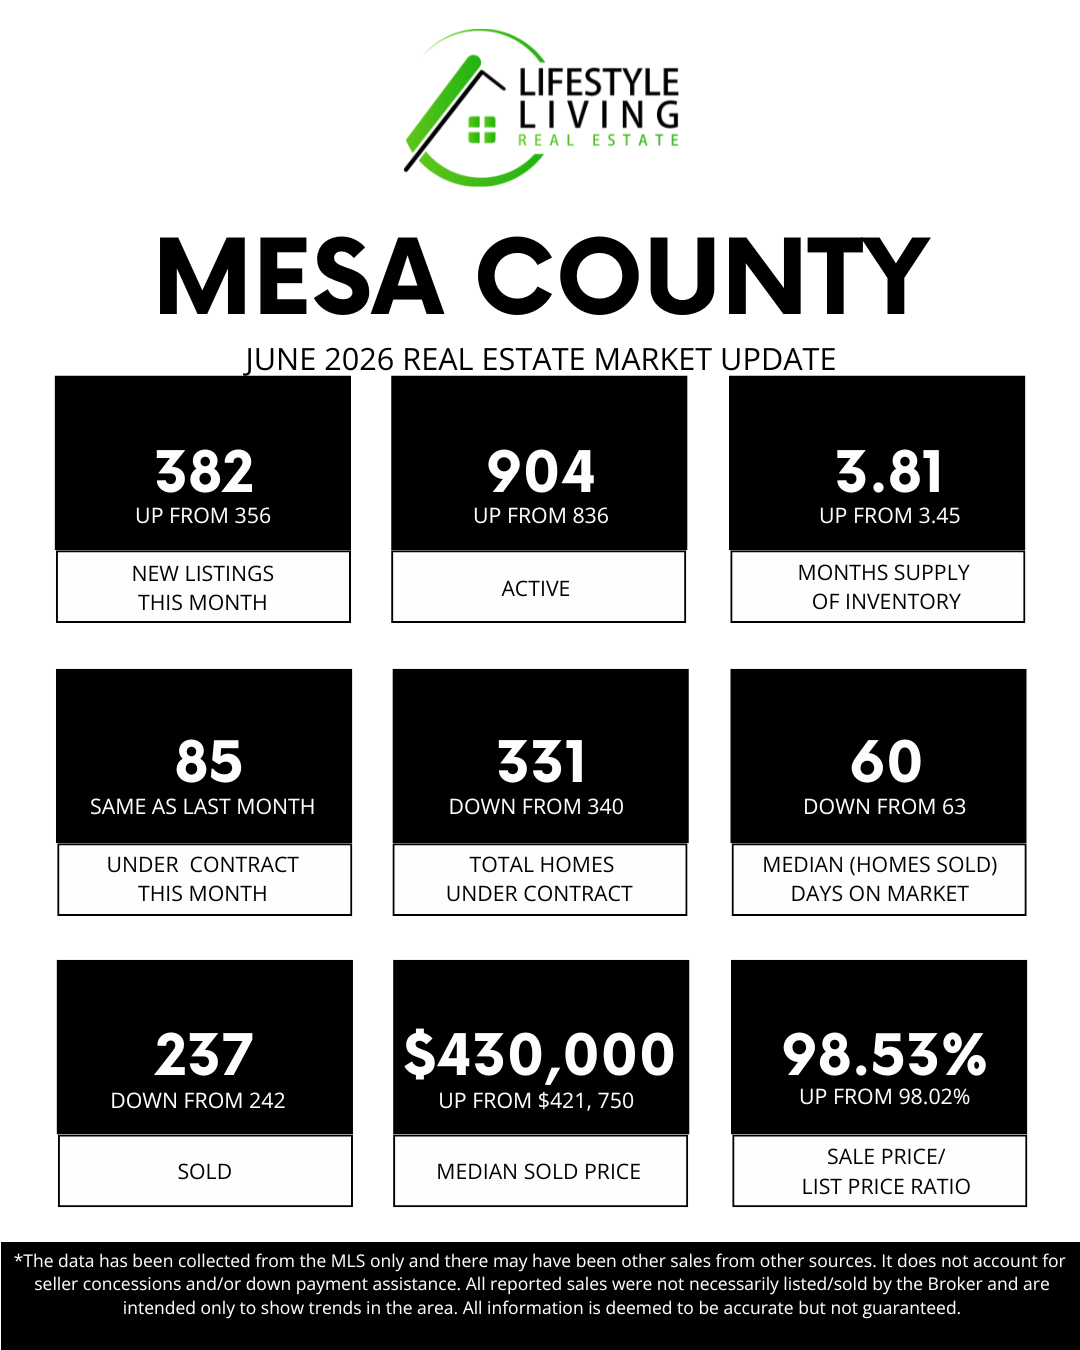
⬆️ NEW LISTINGS IN JUNE: 382, up from 356 🏠
New listings increased again in June as more homeowners took advantage of the summer selling season. Buyers continue to see a healthy flow of fresh inventory entering the market. This increase helps provide more choices across a variety of price points and neighborhoods.

⬆️ TOTAL ACTIVE HOMES: 904, up from 836 📈
Active inventory continued to grow as new listings outpaced home sales. Buyers are benefiting from a wider selection of available properties. This increase is helping create a more balanced market than we’ve seen in recent years.

⬆️ MONTHS SUPPLY OF INVENTORY: 3.81, up from 3.45 📊
The months' supply of inventory increased as more homes became available. While still below the 4–6 months typically considered a balanced market, buyers are gaining more options and flexibility. Sellers should continue to focus on pricing and presentation to remain competitive.

➡️ UNDER CONTRACT IN JUNE: 85, same as last month 📝
The number of homes going under contract remained steady, showing that buyer demand continues despite increased inventory. Buyers are still moving forward when they find the right home. This consistency is a positive sign for the overall health of the market.

⬇️ TOTAL HOMES UNDER CONTRACT: 331, down from 340 🏡
Pending sales dipped slightly from last month. While buyer activity remains steady, the increase in available inventory is giving buyers more time to evaluate their options. Even with this small decline, the number of homes under contract remains strong.

⬇️ MEDIAN (HOMES SOLD) DAYS ON MARKET: 60, down from 63 ⏱️
Homes sold slightly faster in June compared to May. Well-priced and well-presented homes continue to attract attention from motivated buyers. This is encouraging given the increase in available inventory.

⬇️ SOLD IN JUNE: 237, down from 242 🔑
Closed sales were nearly unchanged from the previous month, with only a slight decrease. This indicates that buyers remain active and transactions continue to move through the market. Overall sales volume remains healthy for this time of year.

⬆️ MEDIAN SOLD PRICE: $430,000, up from $421,750 💰
The median sold price increased in June, reflecting continued strength in home values. Buyers are willing to pay for homes that are well-maintained, updated, and appropriately priced. This price growth demonstrates ongoing confidence in the Mesa County market.

⬆️ SALE PRICE / LIST PRICE RATIO: 98.53%, up from 98.02% 📈
Homes sold closer to their asking price on average, indicating strong buyer engagement. Sellers who price their homes correctly are continuing to receive competitive offers. This increase shows that desirable homes remain in demand.

💰 Sold Price Analysis

🏡 Homes Under $499,999: 154 sales

🏘️ Mid-Range Market ($500,000–$999,999): 70 sales

Luxury Market ($1M+): 13 sales

The majority of sales continued to occur in the under $500,000 price range, where affordability remains a key factor for many buyers. Mid-range homes saw solid activity, while luxury sales increased, demonstrating demand across multiple market segments. This broad participation is another sign of a healthy and active market.

📊 June Market Summary

June's market continued to move toward a healthier balance between buyers and sellers. Inventory increased again, giving buyers more choices than they've had in recent years, while steady contract activity and faster selling times show that demand remains strong. In other words, more homes are available, but buyers are still actively purchasing homes that are priced appropriately and show well.

One of the most encouraging signs this month is that home values continue to strengthen. The median sold price increased to $430,000, and homes sold closer to their asking price than they did in May. While buyers have gained a little more flexibility due to increased inventory, desirable homes are still attracting attention and competitive offers. Overall, Mesa County's market remains healthy, with opportunities for both buyers and sellers as we move through the summer season.

This is not the frenzied seller's market we experienced a few years ago, nor is it a buyer's market. Instead, we're seeing a more balanced environment where preparation, pricing, and strategy matter more than ever. Buyers have more options and time to evaluate homes, while sellers who position their homes well continue to achieve strong results.

June 1, 2026

May Housing Market Snapshot: Inventory Grows While Prices Continue to Rise


📊 May Market Trends: Your Guide to Local Real Estate 🏡


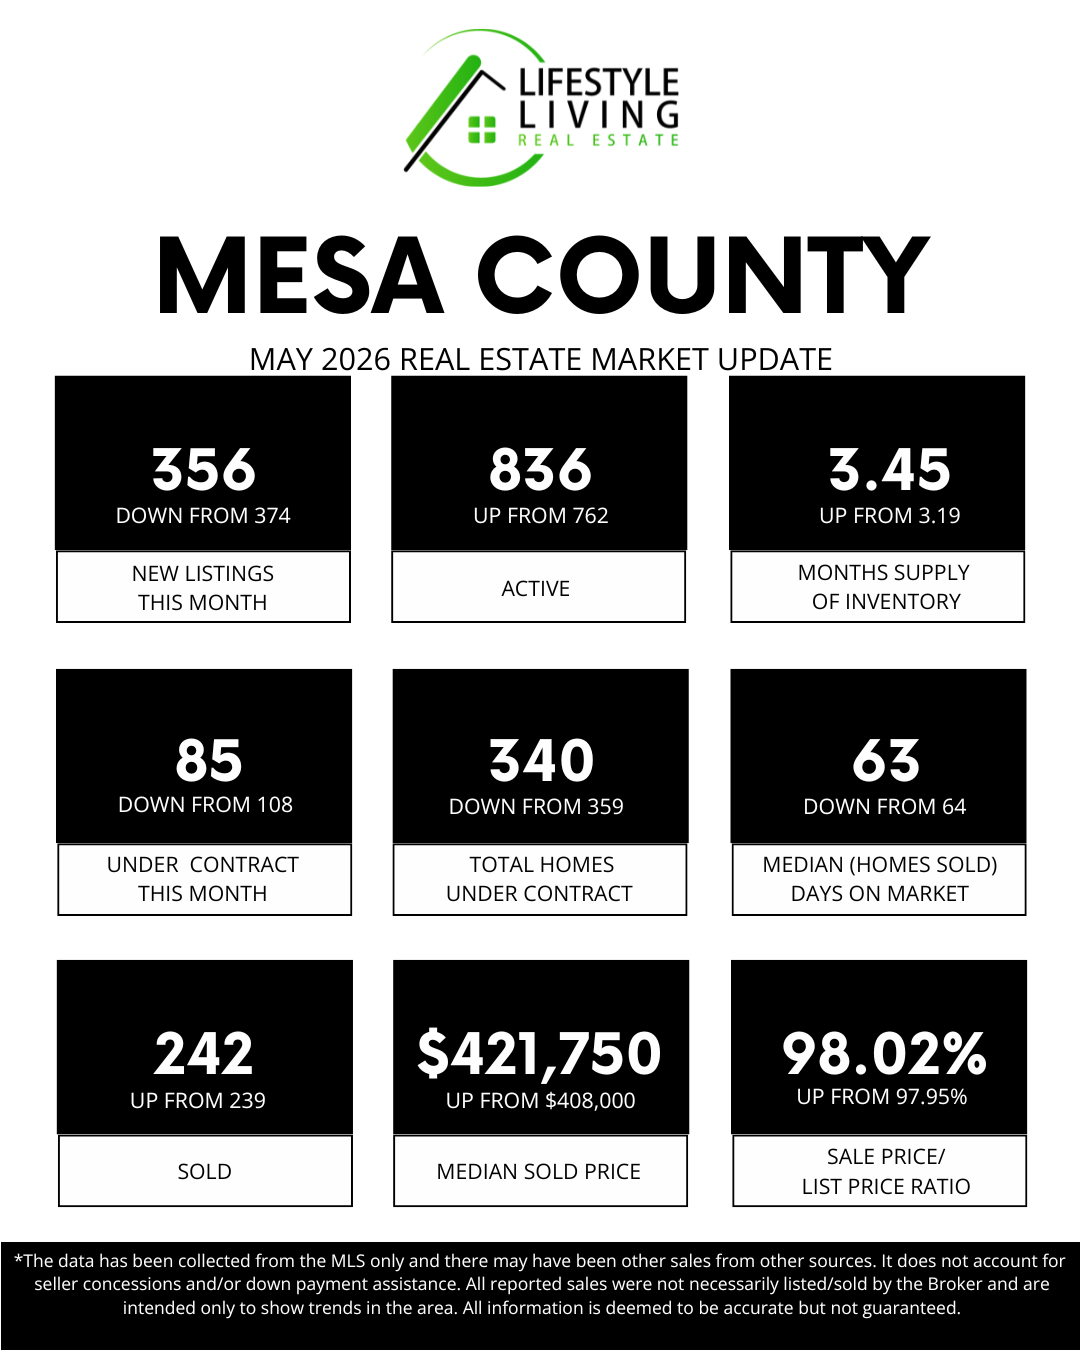
⬇️ NEW LISTINGS IN MAY: 356, down from 374 🏠

New listings decreased slightly in May, indicating that some homeowners may be waiting to list their properties. While inventory remains healthy, fewer new homes entered the market compared to April. This can create additional competition for well-priced homes.

⬆️ TOTAL ACTIVE HOMES: 836, up from 762 📈

Active inventory continued to grow, giving buyers more choices than they had earlier this spring. Increased inventory helps create a more balanced market and allows buyers additional time to evaluate their options.

⬆️ MONTHS SUPPLY OF INVENTORY: 3.45, up from 3.19 📊

Months of inventory increased again in May, moving the market closer to balanced conditions. While sellers still have an advantage in many price ranges, buyers are gaining more negotiating power as inventory rises.

⬇️ UNDER CONTRACT IN MAY: 85, down from 108 📝

While fewer homes went under contract in May compared to April, this is not unusual for our market. Historically, May can be affected by graduations, end-of-school activities, holiday weekends, and the start of summer travel, which can temporarily slow buyer activity.

⬇️ TOTAL HOMES UNDER CONTRACT: 340, down from 359 🏡

The number of homes under contract declined slightly from April, but this follows a seasonal pattern we've seen in previous years. Many buyers and sellers are focused on family events, vacations, and summer planning, which often causes activity to pick up again later in the season.

⬇️ MEDIAN (HOMES SOLD) DAYS ON MARKET: 63, down from 64 ⏱️

Homes sold slightly faster in May, with the median days on market decreasing by one day. Well-prepared and appropriately priced homes continue to attract buyers and move more quickly.

⬆️ SOLD IN MAY: 242, up from 239 🔑

Closed sales increased modestly in May, showing that buyers are still successfully completing transactions. Despite some softening in pending activity, demand remains present in the market.

⬆️ MEDIAN SOLD PRICE: $421,750, up from $408,000 💰

Home values saw a healthy increase in May, with the median sold price rising nearly 3.4% from April. This demonstrates continued strength in the local market and positive equity growth for homeowners.

⬆️ SALE PRICE / LIST PRICE RATIO: 98.02%, up from 97.95% 📈

Sellers received slightly more of their asking price in May compared to April. Proper pricing remains important, but buyers continue to recognize value in desirable homes.

💰 Sold Price Analysis

🏡 Homes Under $499,999: 165 sales

🏘️ Mid-Range Market ($500,000–$999,999): 67 sales

Luxury Market ($1M+): 10 sales

The majority of sales continue to occur below $500,000, demonstrating strong demand in the entry-level and move-up buyer segments. Luxury sales remained steady, while the mid-range market continues to be an important part of overall market activity.

📊 May Market Summary

May brought more inventory to the market, giving buyers additional choices and moving the market toward more balanced conditions. While pending sales and homes under contract were lower than in April, this follows a seasonal trend we often see in Mesa County as graduations, Memorial Day weekend, and the start of summer travel temporarily shift people's focus away from home shopping.

The good news is that homes sold slightly faster, closed sales increased, and the median sold price rose to $421,750. Sellers continued to receive approximately 98% of their asking price, demonstrating that well-prepared and properly priced homes remain in demand.

As we move into the summer months, it will be interesting to see whether buyer activity rebounds as families settle into their summer schedules and continue their home search. If you're considering buying or selling, I'd be happy to discuss how these trends may impact your specific real estate goals.

May 1, 2026

Mesa County Real Estate Market Update – April 2026


📊 April Market Update | Mesa County 🏡

The spring market is in full swing! 🌷 Inventory continues to grow, giving buyers more options, while buyer activity is still strong with more homes going under contract and more sales closing.

Homes are taking just a little longer to sell, but they’re still selling close to the asking price, showing that demand remains steady. Overall, we’re seeing a more balanced market, creating opportunities for both buyers and sellers this season.

Thinking about making a move this spring? I’d love to help you navigate your options! 🏡✨


April 1, 2026

March Market Update | Mesa County

📊 March Market Trends: Your Guide to Local Real Estate 🏡
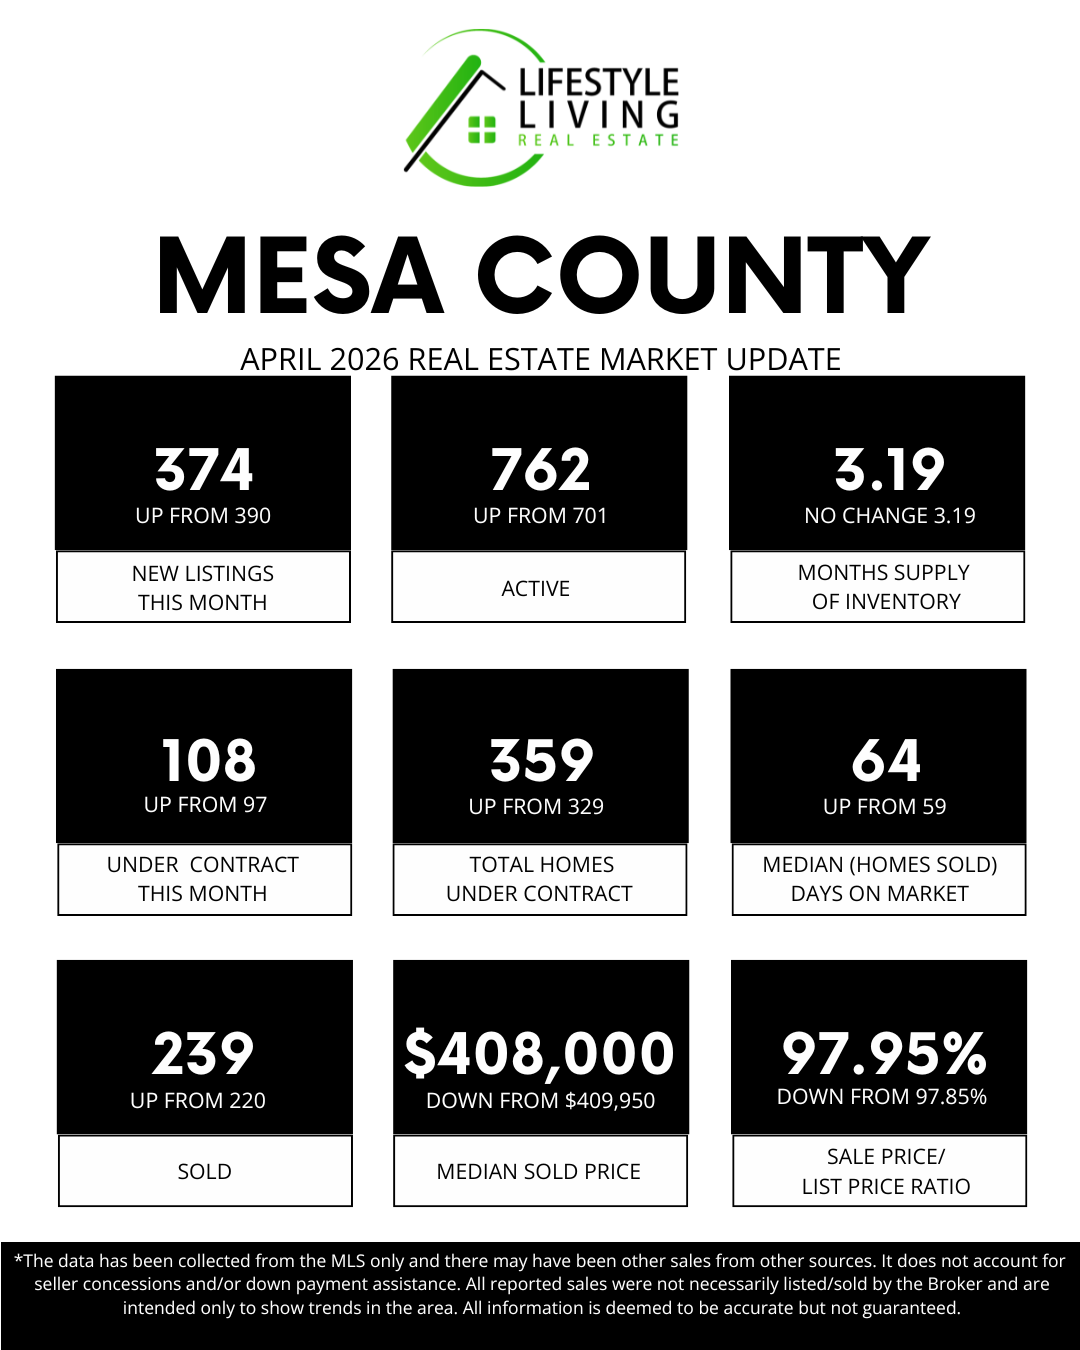
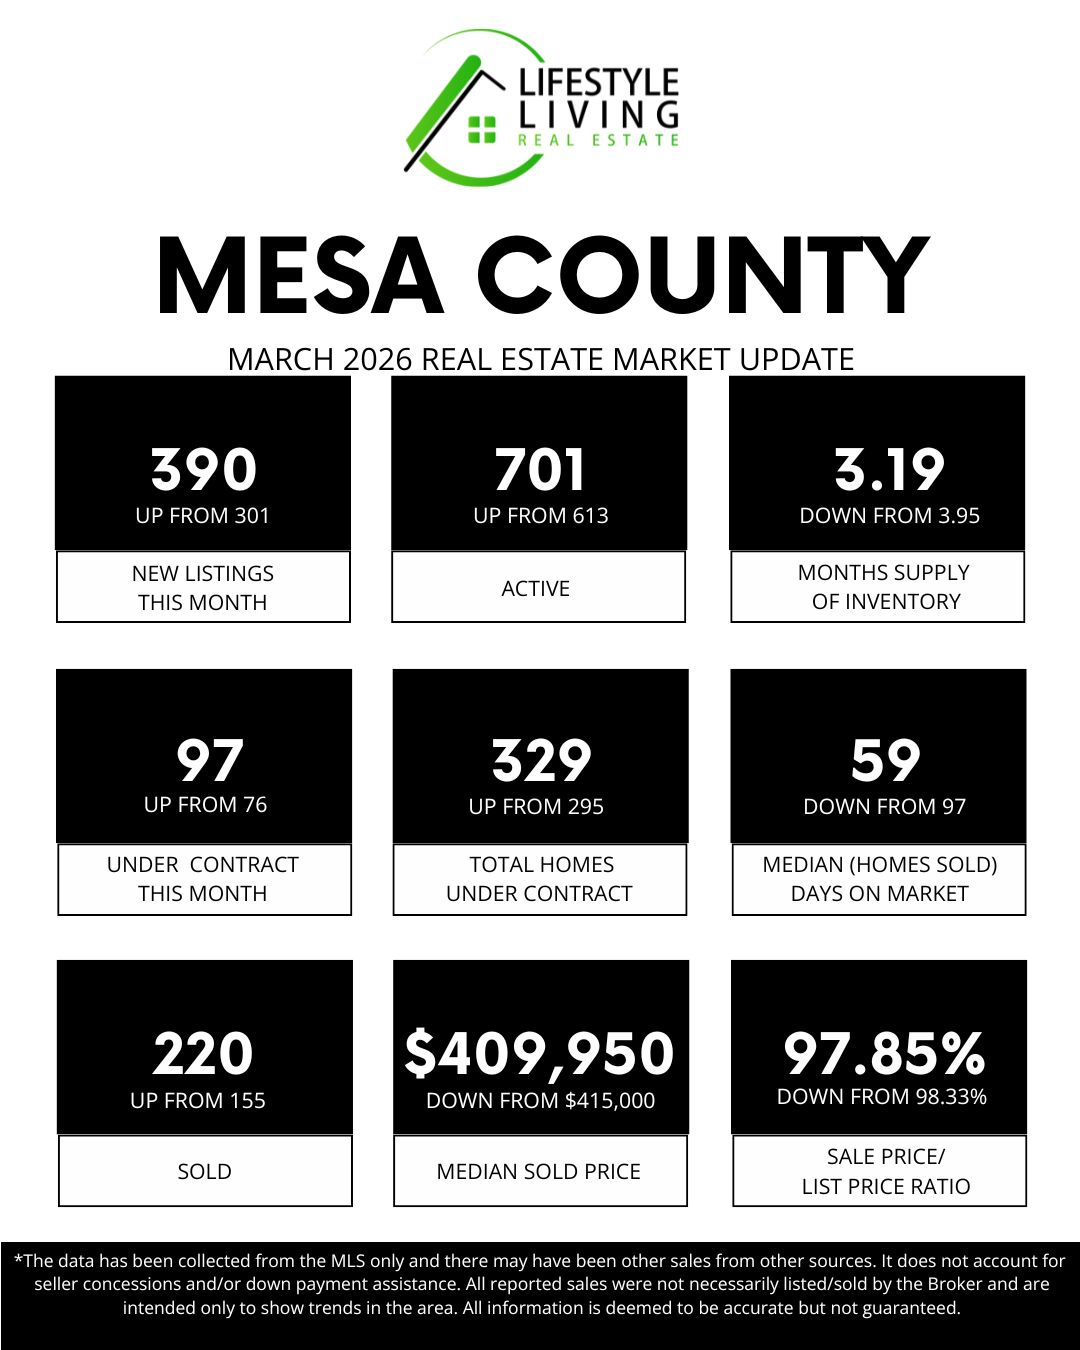
⬆️ NEW LISTINGS IN MARCH: 390, up from 301 🏡
New listings increased in March, which is typical as we move into the spring market. Many homeowners choose this time of year to list, which brings more options for buyers. This seasonal rise reflects the start of peak real estate activity.

⬆️ TOTAL ACTIVE HOMES: 701, up from 613 📊
Active inventory also increased as more homes came onto the market. Buyers are seeing a wider selection across different price points. This is a normal part of the spring market as inventory begins to build.

⬇️ MONTHS SUPPLY OF INVENTORY: 3.19, down from 3.95 📉
Even with more homes available, strong buyer activity reduced the overall supply. Homes are selling quickly enough to prevent inventory from piling up. This shows demand is keeping pace with the increase in listings.

⬆️ UNDER CONTRACT IN MARCH: 97, up from 76 📜
More homes went under contract, showing buyers are actively making decisions. As more options become available, buyers are finding homes that meet their needs. This is a key sign of a healthy, active market.

⬆️ TOTAL HOMES UNDER CONTRACT: 329, up from 295 🏠
The number of homes under contract increased, creating a strong pipeline for future closings. This reflects continued buyer engagement as we move into spring. It also supports the increase we’re seeing in closed sales.

⬇️ MEDIAN (HOMES SOLD) DAYS ON MARKET: 59, down from 97 ⏳
Homes sold significantly faster in March compared to February. With more buyers in the market, well-priced homes are moving quickly. This is a typical shift as the spring season gains momentum.

⬆️ SOLD IN MARCH: 220, up from 155 🪧
Closed sales increased, showing strong follow-through from earlier buyer activity. More contracts are successfully reaching the closing table. This reflects growing confidence and momentum in the market.

⬇️ MEDIAN SOLD PRICE: $409,950, down from $415,000 📉
The median price dipped slightly, which can happen as more inventory enters the market. A wider range of homes at different price points can influence the median. Overall, pricing remains stable and consistent with a healthy market.

⬇️ SALE PRICE / LIST PRICE RATIO: 97.85%, down from 98.33% 📉
Homes sold just slightly below the asking price on average. With more choices available, buyers have a bit more room to negotiate. This is a normal adjustment as the market becomes more balanced.


💰 Sold Price Analysis

🏡 Homes Under $499,999: 159 sales
🏘️ Mid-Range Market ($500,000–$999,999): 51 sales
💲 Luxury Market ($1M+): 10 sales

Most activity remained in the under $500,000 price range, where demand continues to be strongest. Mid-range and luxury homes also saw increased activity this month. This shows buyers are active across multiple price points as the market picks up.


📊 March Market Summary


March reflects a strong start to the spring market, with increases in listings, buyer activity, and closed sales. Homes are selling faster, and demand is keeping pace with the growing inventory. Overall, the market is becoming more active and balanced, creating opportunities for both buyers and sellers.

March 1, 2026

February 2026 Real Estate Market Update for Mesa County

February Real Estate Market Stats for Mesa County


📊February Market Trends: Your Guide to Local Real Estate🏡


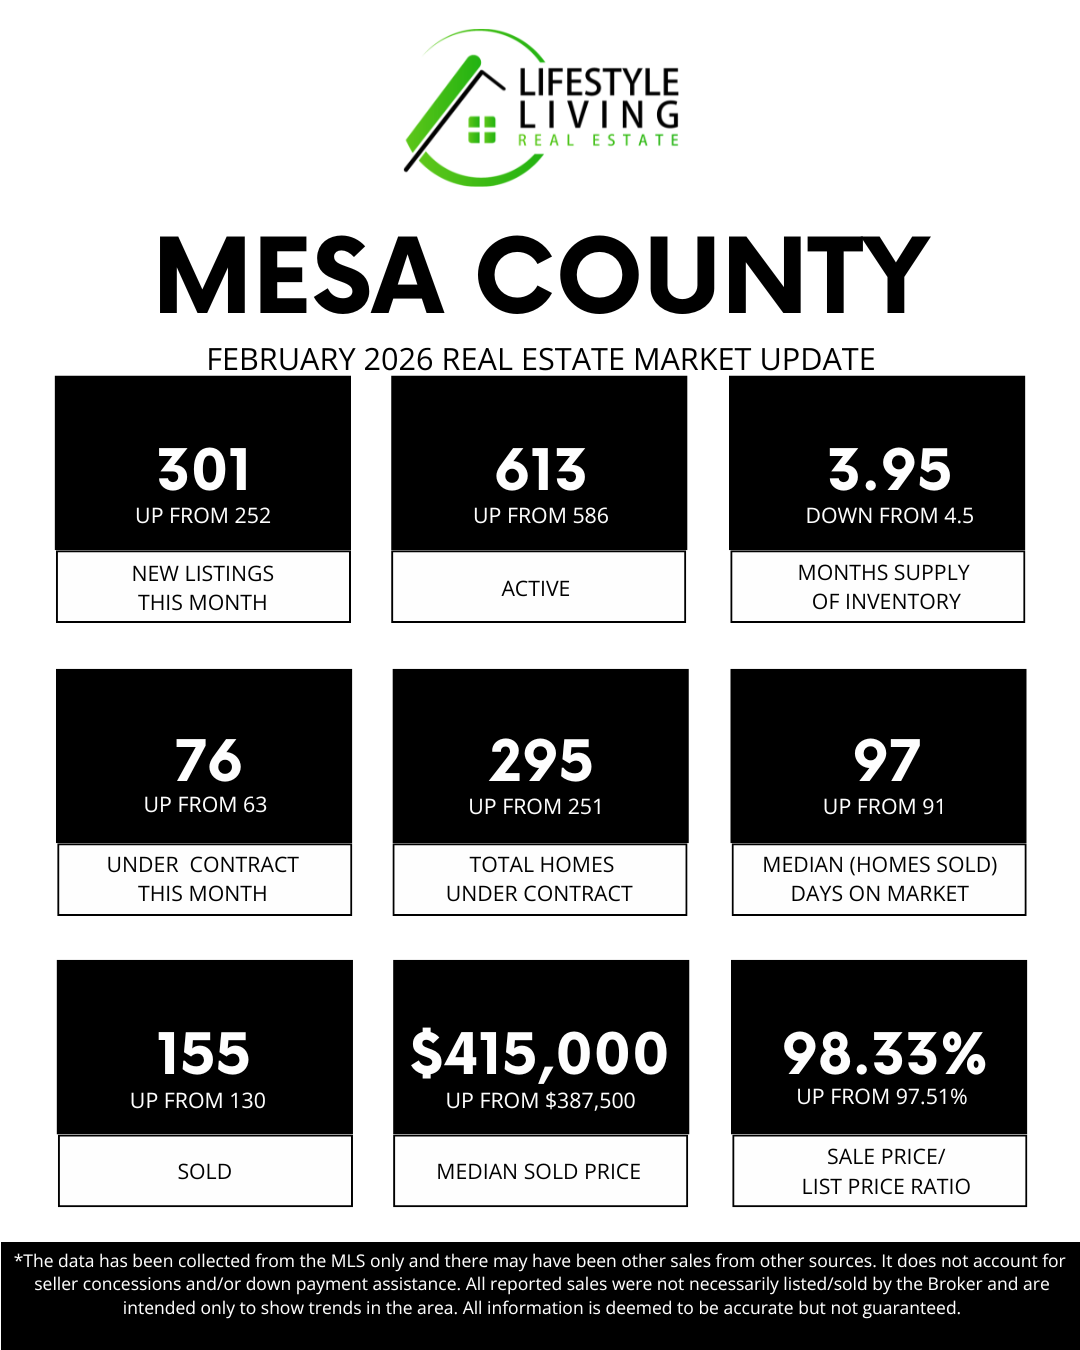
⬆️ NEW LISTINGS IN FEBRUARY: 301, up from 252 🏡

New listings continued to rise in February as more homeowners prepared for the upcoming spring market. This seasonal increase is common as sellers begin planning moves after the winter months. Buyers are seeing more fresh opportunities entering the market compared to the start of the year.


⬆️ TOTAL ACTIVE HOMES: 613, up from 585 📊

Active inventory grew slightly as new listings outpaced completed sales. This gives buyers more choices and a wider range of options across price points. The gradual increase signals a market slowly opening up as we transition toward spring activity.


⬇️ MONTHS SUPPLY OF INVENTORY: 3.95, down from 4.5 📉

Even with more homes available, stronger buyer activity reduced overall inventory supply. Demand is keeping pace with new listings, preventing inventory from building too quickly. The market remains competitive while moving toward a healthier balance.


⬆️ UNDER CONTRACT IN FEBRUARY: 76, up from 63 📜

More buyers went under contract in February, showing growing confidence as the year gains momentum. Improved affordability and seasonal optimism helped encourage buyers to move forward. This increase is often an early indicator of stronger spring sales ahead.


⬆️ TOTAL HOMES UNDER CONTRACT: 295, up from 251 🏠

Pending sales climbed as buyer activity continued to build month over month. A larger number of homes in escrow creates a solid pipeline for upcoming closings. This reflects steady engagement from buyers despite longer decision timelines.


⬆️ MEDIAN (HOMES SOLD) DAYS ON MARKET: 97, up from 91 ⏳

Homes are taking slightly longer to sell as buyers gain more options and take time to compare properties. With increased inventory, buyers are approaching decisions more thoughtfully. Proper pricing and strong presentation remain essential for sellers looking to stand out.


⬆️ SOLD IN FEBRUARY:155, down from 130 🪧

Closed sales increased from January, reflecting contracts written earlier in the year. This rise shows market activity beginning to rebound after the slower winter season. Momentum is gradually building as we move closer to spring.


⬆️ MEDIAN SOLD PRICE: $415,000, up from $387,500 📈

The median sold price rose noticeably, demonstrating continued strength in home values. Well-prepared and competitively priced homes continue to attract strong buyer interest. Price growth reflects steady demand even as the market becomes more balanced.

.

⬆️ SALE PRICE / LIST PRICE RATIO: 98.33%, up from 97.51 📈

Homes sold closer to their asking price on average, indicating stronger alignment between buyers and sellers. Competitive pricing strategies are helping sellers achieve solid results. This improvement suggests buyers remain motivated when homes are positioned correctly in the market.

💰 Sold Price Analysis

🏡 Homes Under $499,999: 111 sales
🏘️ Mid-Range Market ($500,000–$999,999): 40 sales
💲 Luxury Market ($1M+): 4 sales

Most activity remained concentrated in homes under $500,000, where affordability continues to drive demand. Mid-range sales remained steady, while luxury properties accounted for a smaller share of transactions. This distribution shows buyers remain value-conscious even as overall activity increases.


📊 February Market Summary

February’s numbers show early signs of the spring market taking shape, with increases in listings, pending contracts, closed sales, and home prices. Buyers are becoming more active, while expanded inventory gives them slightly more time to make decisions. Overall, Mesa County’s housing market is moving toward a more balanced and active environment as we head into the busy spring season.

Feb. 1, 2026

January Market Numbers—Explained

January 2026 Market Trends Mesa County Residential


📊January Market Trends: Your Guide to Local Real Estate🏡


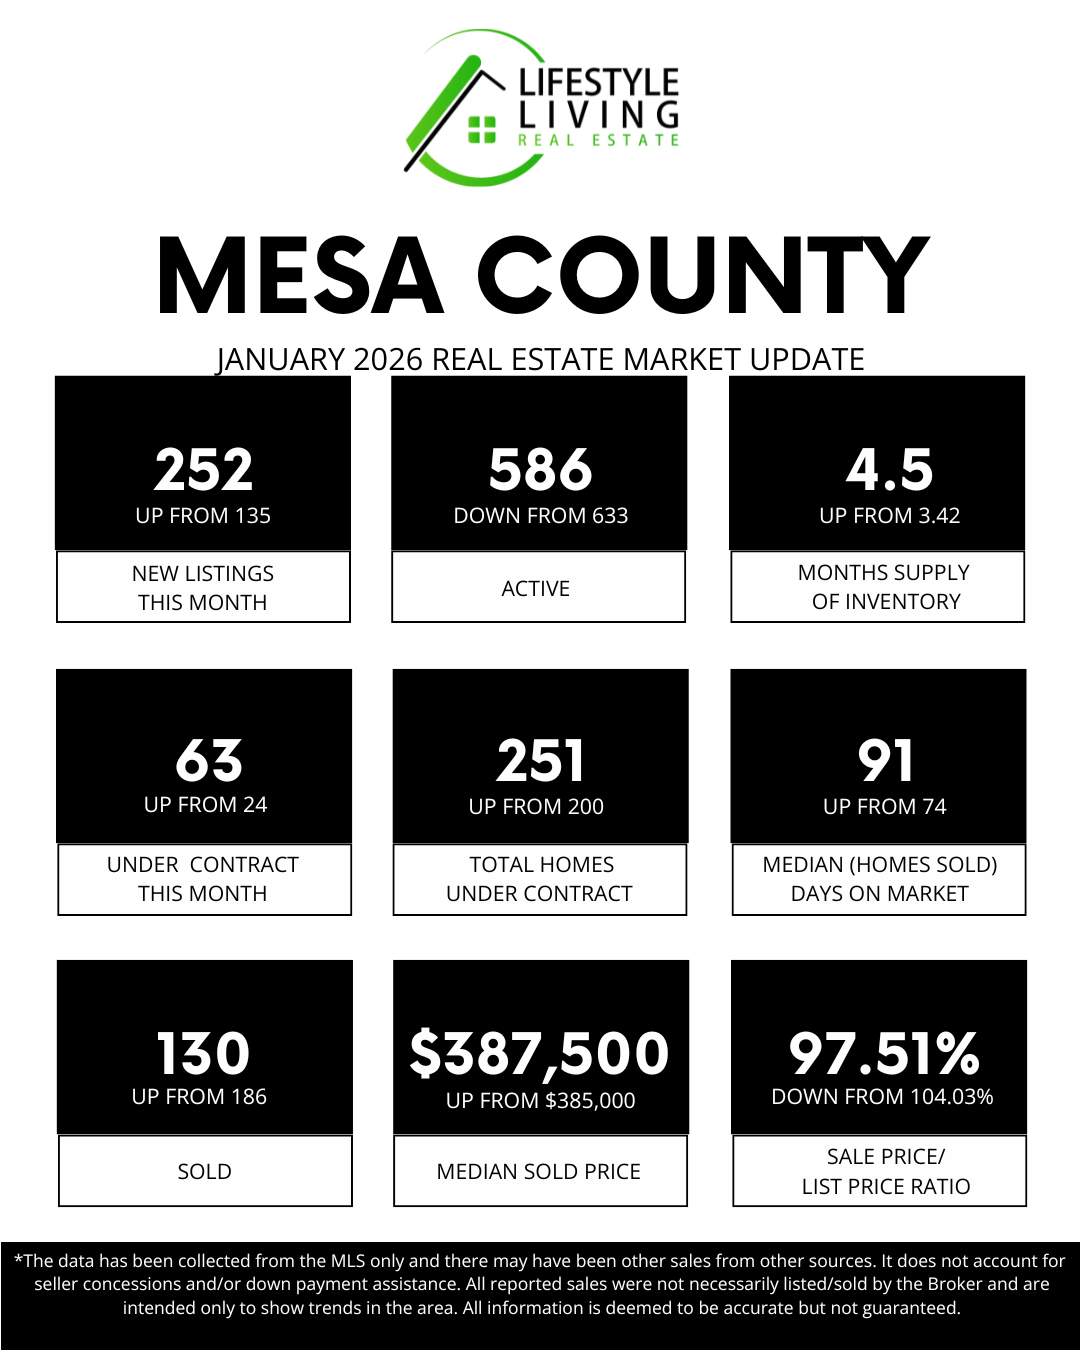
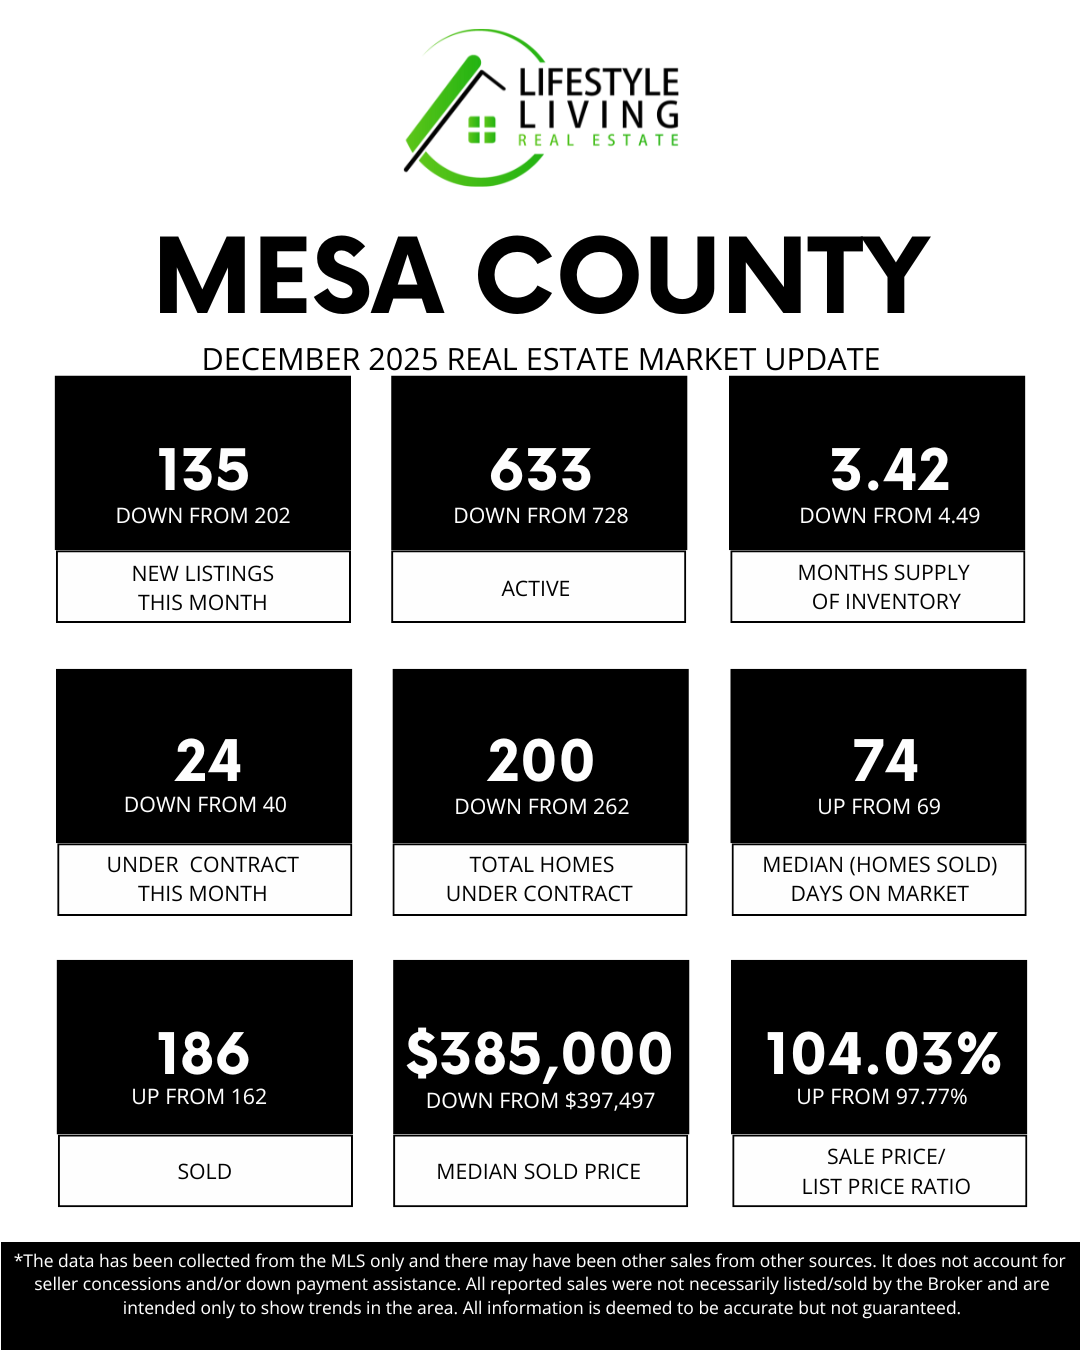
⬆️ NEW LISTINGS IN JANUARY: 252, up from 135 🏡
New listings increased significantly in January as more sellers entered the market after the holidays. This is a common seasonal pattern as homeowners kick off the new year with fresh plans. The increase gives buyers more options than in December.


⬇️ TOTAL ACTIVE HOMES: 586, down from 633 📊
Even with more new listings, total active inventory declined. This indicates that homes were being absorbed through sales, contracts, or seasonal expired listings. It shows buyer activity picking up enough to offset new inventory coming online.


⬆️ MONTHS SUPPLY OF INVENTORY: 4.5, up from 3.42 ​📈
Months of inventory increased in January, signaling a shift toward a more balanced market. With more listings coming on and homes taking longer to sell, buyers have gained a bit more breathing room. While this still isn’t an oversupplied market, it does encourage sellers to price and prepare their homes carefully.


⬆️ UNDER CONTRACT IN JANUARY: 63, up from 24 📜
Buyer activity increased noticeably in January, with more homes going under contract. This jump reflects buyers re-entering the market after the holidays. It’s a strong sign of renewed momentum heading into the spring season.


⬆️ TOTAL HOMES UNDER CONTRACT: 251, up from 200 🏠
The total number of homes under contract also rose, building a healthier pipeline of pending sales. This suggests continued buyer engagement beyond just new activity. These contracts will likely support future closed sales in the coming months.


⬆️ MEDIAN (HOMES SOLD) DAYS ON MARKET: 91, up from 74 ⏳
Homes took longer to sell in January, as is typical in winter and the holiday season. Well-priced and well-prepared homes still sold, but timelines stretched slightly.


⬇️ SOLD IN JANUARY: 130, down from 186 🪧
Closed sales declined, reflecting contracts written late in the year when activity was slower. Since closings lag behind contracts, this decrease aligns with December’s quieter market. With more homes now under contract, future sales numbers may improve.


⬆️ MEDIAN SOLD PRICE: $387,500, up from $385,000 📈
Despite fewer sales, prices remained stable with a slight increase in the median sold price. This suggests demand remains strong for well-located, well-maintained homes. Values are holding steady, even during the slower winter season

.

⬇️ SALE PRICE / LIST PRICE RATIO: 97.51%, down from 104.03% 📉
Homes sold slightly below list price on average, a shift from last month’s aggressive pricing. This reflects a more balanced negotiation environment. Buyers have a bit more room, while sellers need to price strategically.


💰 Sold Price Analysis

🏡 Homes Under $499,999: 94 sales
🏘️ Mid-Range Market ($500,000–$999,999): 33 sales
💲 Luxury Market ($1M+): 3 sales

Most activity continued in the more affordable price ranges, where buyer demand remains strongest. Mid-range and luxury homes saw fewer sales, which is typical during winter months. This distribution highlights the continued importance of affordability in today’s market.


📊 January Market Summary

January showed a clear re-engagement from both buyers and sellers after the holidays. New listings and contracts increased, inventory tightened slightly, and prices held steady, even as winter slowed overall sales volume. As we move toward spring, these trends suggest growing momentum and a market that is actively positioning itself for the months ahead.

Jan. 1, 2026

January Market Update: What to Know as the Year Begins

📊 December 2025 Mesa County Real Estate Market Summary

The December real estate market in Mesa County reflected a typical year-end slowdown, with fewer new listings, tighter inventory, and a more selective group of buyers. While activity naturally cooled during the holiday season, well-priced homes continued to sell, and buyer demand remained steady across many price points. The slight increase in days on market points to thoughtful buyer decision-making rather than a decline in market strength.


As we move into the new year, the Mesa County housing market is expected to regain momentum as buyers and sellers return with fresh goals. Understanding current market conditions, pricing trends, and inventory levels can help both buyers and sellers make informed decisions as we head into the spring market.

Nov. 1, 2025

Mesa County Real Estate Market Update — October 2025


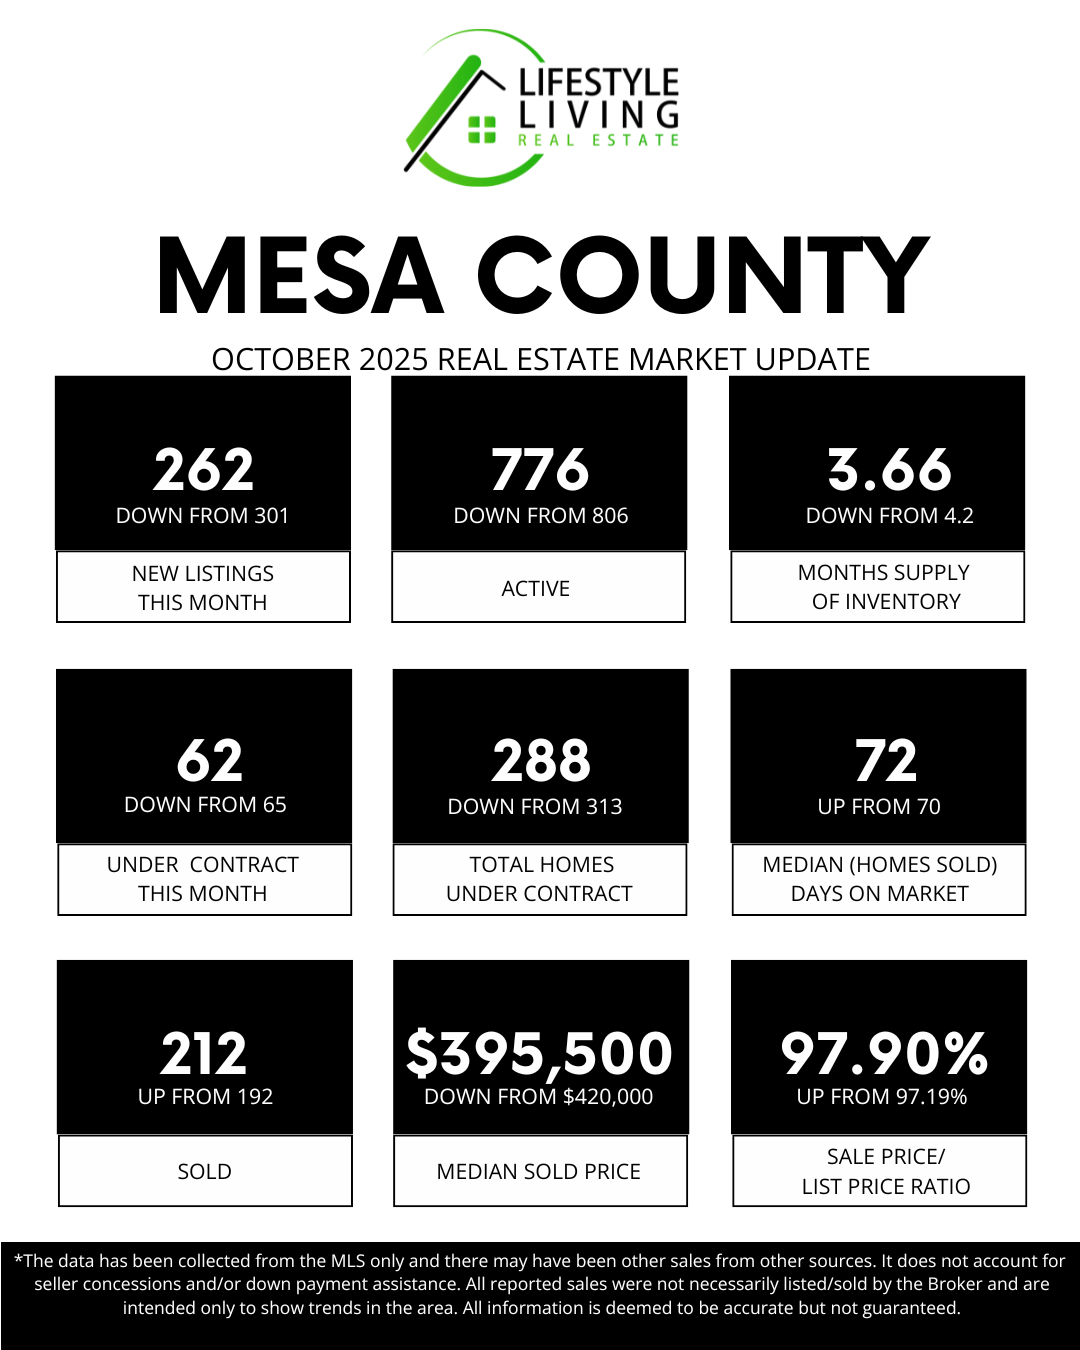
⬇️ NEW LISTINGS IN OCTOBER: 262, down from 301 🏡

Fewer new homes came on the market in October, which is typical as we head into the holiday season. With fewer fresh listings, buyers have slightly less to choose from, and well-priced homes stand out even more.

⬇️ TOTAL ACTIVE HOMES: 776, down from 806 📊

Overall inventory dipped this month, signaling a seasonal tightening in housing supply. While we are still ahead of last year’s levels — when only 669 homes were available — buyers may notice less selection compared to late summer. This slight pullback in active listings reinforces the importance of pricing and presentation as we move into the winter market.

⬇️ MONTHS SUPPLY OF INVENTORY: 3.66, down from 4.2 📈

The supply of available homes moved further away from a balanced 4–7 month range, leaning back toward a seller-advantaged market. This suggests demand remains steady enough to absorb inventory even as new listings slow.


⬇️ UNDER CONTRACT IN OCTOBER: 62, down from 65 📜

Buyer activity softened slightly, which is common this time of year as holidays approach and families shift focus. Serious buyers are still in the market — just moving a bit more selectively.

⬇️ TOTAL HOMES UNDER CONTRACT: 288, down from 313 🏠

The decline in homes under contract reflects seasonal slowing and buyer caution. Sellers who price strategically and present their homes well will continue to attract committed buyers.

⬆️ MEDIAN (HOMES SOLD) DAYS ON MARKET: 72, up from 70 ⏳

Homes are taking just a little longer to sell, another sign of a calmer fall market. This gives buyers more breathing room, though desirable homes still move quickly.

⬇️ SOLD IN OCTOBER: 212, up from 192 🪧

Despite slower contract activity, more homes closed in October — indicating contracts written earlier in the fall are now finalizing. This is encouraging momentum as we move into year-end.

⬆️ MEDIAN SOLD PRICE $395,500, down from $420,000 📈

The median sold price declined this month, reflecting a softer pricing environment as we head into the fall and winter season. While prices can fluctuate month to month, this shift is a reminder for sellers to stay competitive on pricing and condition, as today’s buyers are value-focused and patient.


⬇️ SALE PRICE/LIST PRICE RATIO: 97.90%, up from 97.19% 📉

Homes are selling closer to the list price, showing sellers are pricing more accurately and buyers are making realistic offers. This is a sign of a healthy, data-driven market.


💰 SOLD PRICE ANALYSIS:

🏡 Homes Under $499,999: 147 sales

🏘️ Mid-Range Market ($500,000–$999,999): 60 sales

💲 Luxury Market ($1M+): 6 sales

In summary, the Mesa County housing market reflected a typical seasonal slowdown as we moved deeper into fall. New listings and overall active inventory both declined, giving buyers fewer options than earlier in the year. Homes under contract also dipped slightly, and days on market ticked up — signs that buyers are taking a more measured approach. Even so, closings remained strong, and homes continued selling near list price, showing resilience and steady demand. With months of inventory decreasing and prices adjusting, sellers who price strategically and present their homes well are still in a favorable position. At the same time, buyers benefit from a bit more breathing room and negotiating opportunity than we saw during peak summer activity.

Oct. 2, 2025

SEPTEMBER Market Trends: Your Guide to Local Real Estate

September Market Statistics for Mesa County
📊SEPTEMBER Market Trends: Your Guide to Local Real Estate🏡
 
⬇️ NEW LISTINGS IN SEPTEMBER: 301, down from 319 🏡
September saw slightly fewer new listings compared to August. This seasonal slowdown is common as families settle into fall routines. Buyers had fewer fresh options, making well-priced homes stand out even more.
 
⬆️ TOTAL ACTIVE HOMES: 806, up from 798 📊
Despite fewer new listings, the overall number of active homes increased again. This suggests some properties are taking longer to sell. Buyers benefit from more choices, while sellers may need to sharpen pricing strategies.
 
⬆️ MONTHS SUPPLY OF INVENTORY: 4.2, up from 3.3 📈
Inventory supply jumped in September, moving the market closer to balance. A 4–6 month supply typically indicates a neutral market, where neither side has a significant advantage. This shift gives buyers more room to negotiate.
 
⬇️ UNDER CONTRACT IN SEPTEMBER: 65, down from 70 📜
Fewer buyers went under contract compared to last month. This shows a slight dip in new buyer activity. Even so, serious buyers are still writing offers when they find the right fit.
 
⬇️ TOTAL HOMES UNDER CONTRACT: 313, up from 309 🏠
The total number of homes under contract increased, despite fewer new contracts being signed. This means more transactions are still in progress. It reflects steady demand despite seasonal slowdowns.
 
⬆️ MEDIAN (HOMES SOLD) DAYS ON MARKET: 70, up from 56 ⏳
Homes sold in September took longer to go under contract compared to August. Rising days on market suggest buyers have more time to make decisions. Sellers should prepare for slightly longer timelines.
 
⬇️ SOLD IN SEPTEMBER: 192, down from 241 🪧
Closed sales fell more noticeably in September. This aligns with the dip in contracts earlier in the summer. It’s a reminder that closings often trail buyer activity by several weeks.
 
⬆️ MEDIAN SOLD PRICE $420,000, up from $406,580 📈
The median sold price rose in September, despite a decrease in sales volume. This indicates that well-presented homes continue to command strong values. Buyers are selective, but they’re willing to pay for quality.
 
⬇️ SALE PRICE/LIST PRICE RATIO: 97.19%, down from 97.89% 📉
Sellers received a slightly smaller percentage of their asking price compared to August. This signals more negotiation power for buyers. Correct pricing from the start is key to securing stronger offers.
 
💰 SOLD PRICE ANALYSIS:
🏡 Homes Under $499,999: 128 sales
🏘️ Mid-Range Market ($500,000–$999,999): 58 sales
💲 Luxury Market ($1M+): 6 sales
 
September’s market shows a shift toward more balance, with inventory climbing to 4.2 months and homes taking longer to sell. Although overall sales volume decreased, prices remained steady, with the median sold price rising to $420,000. The bulk of activity remains in the more affordable range, with 128 homes selling for under $499,999, 58 sales in the mid-range between $500,000 and $999,999, and 6 homes closing in the $1M+ luxury market. This mix highlights that while buyers have more time and leverage, well-positioned homes across all price points continue to move.
 
Are you ready to explore your real estate options or have questions about these statistics? Let’s discuss how these numbers can impact your buying or selling strategy!😄 🌟
Sept. 1, 2025

AUGUST Market Trends: Your Guide to Local Real Estate

✨AUGUST Market Trends: Your Guide to Local Real Estate 📈
 
⬇️NEW LISTINGS IN AUGUST: 319, down from 360🏡
Fewer homes came on the market this August compared to last month, which means buyers had slightly less fresh inventory to choose from. This could be a sign that some sellers are waiting for fall before listing their homes.
 
⬆️TOTAL ACTIVE HOMES: 798, up from 764 📊
Despite fewer new listings, the total number of active homes increased. This suggests that homes are staying on the market longer or that demand has eased slightly.
 
⬆️MONTHS SUPPLY OF INVENTORY: 3.30, up from 3.13 📈
Inventory levels rose modestly, bringing us closer to a balanced market. A 4–6 month supply is generally considered balanced, so buyers are still facing competition, but conditions are slowly shifting.
 
⬇️UNDER CONTRACT IN AUGUST: 70, down from 87 📜
Fewer buyers went under contract last month, showing a slight dip in new activity. This is a reminder that while some buyers are slowing down, others are still moving forward when they find the right home.
 
⬇️TOTAL HOMES UNDER CONTRACT: 309, down from 347 🏠
The overall number of homes currently under contract is also down. This may indicate a more cautious buyer pool heading into fall.
 
⬇️MEDIAN (HOMES SOLD) DAYS ON MARKET: 56, down from 57 ⏳
Even with shifting numbers, homes that sold last month went under contract just a bit faster. This indicates that well-priced, move-in-ready homes continue to attract buyers quickly.
 
⬇️SOLD IN AUGUST: 241, down from 244 🪧
Closed sales remained nearly the same compared to the prior month, with only a slight decrease. This steadiness indicates that many transactions already in progress have successfully reached the closing table.
 
⬇️MEDIAN SOLD PRICE $406,580, down from $435,000 📉
The median sold price slipped in August, giving buyers some additional leverage in negotiations. However, prices remain strong compared to long-term trends.
 
⬇️ SALE PRICE/LIST PRICE RATIO: 97.89%, down from 98.40% 📉
Sellers received slightly less of their asking price on average, indicating that buyers are negotiating more effectively. Pricing homes strategically is more important than ever in today’s market.
 
💰 Price Analysis:
🏡 Homes Sold Under $499,999: 171 sales
🏘️ Mid-Range Market ($500,000–$999,999): 65 sales
💲 Luxury Market ($1M+): 5 sales
 
Are you ready to explore your real estate options or have questions about these statistics? Let’s discuss how these numbers can impact your buying or selling strategy!😄 🌟