Area Real Estate News & Market Trends

You’ll find our blog to be a wealth of information, covering everything from local market statistics and home values to community happenings. That’s because we care about the community and want to help you find your place in it. Please reach out if you have any questions at all. We’d love to talk with you!

Aug. 1, 2025

✨July Market Trends: Your Guide to Local Real Estate ????

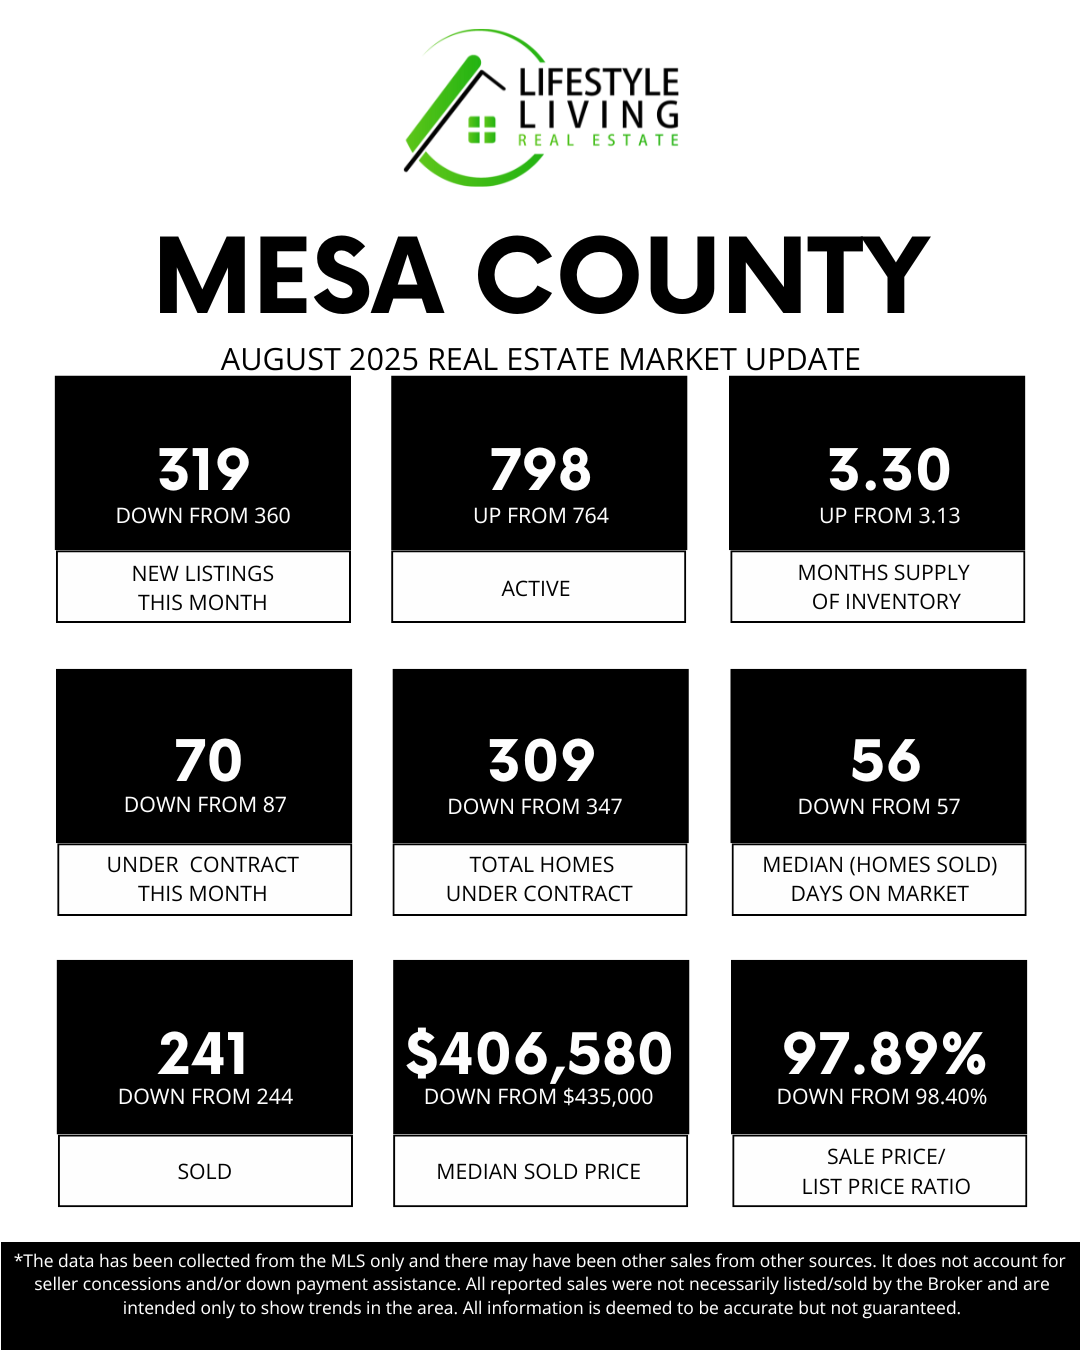
⬆️NEW LISTINGS IN JULY: 360, up from 354🏡
The modest increase in new listings reflects a slight rise in seller confidence. While inventory remains relatively tight, this increase gives buyers more options, which can help ease some of the competition we've seen in previous months.
 
⬆️TOTAL ACTIVE HOMES: 764, up from 719 📊
We’re seeing a gradual build in overall inventory, which is a positive trend toward a more balanced market. Sellers should take note: with more homes available, strategic pricing and presentation are becoming increasingly important.
 
⬆️MONTHS SUPPLY OF INVENTORY: 3.13, up from 2.86 📉
The months of inventory has inched closer to a balanced market, which typically ranges from 4 to 6 months. While we’re still in a seller’s market, the shift suggests buyers are gaining a bit more leverage, especially in price negotiations.
 
⬇️UNDER CONTRACT IN JULY: 87, down from 90 📜
Pending sales dipped slightly, which could indicate buyer hesitation due to interest rates, affordability, or seasonal trends. It’s a reminder for sellers that demand remains but buyers are becoming more selective.
 
⬇️TOTAL HOMES UNDER CONTRACT: 347, down from 367 🏠
The total number of homes under contract has decreased, reinforcing the theme of a softening pace in buyer activity. Homes that show well and are priced appropriately will continue to stand out in this evolving market.
 
⬆️MEDIAN (HOMES SOLD) DAYS ON MARKET: 57, down from 60 ⏳
Homes are spending slightly less time on the market compared to last month. This suggests that serious buyers are still active and are moving quickly when the right property becomes available.
 
⬇️SOLD IN JULY: 244, down from 251 🪧
The number of closed sales in July was marginally lower than June. While not a significant drop, it highlights the importance of pricing homes correctly from the start to ensure a timely sale.
 
⬇️MEDIAN SOLD PRICE $435,000, up from $420,000 📉
Despite a minor slowdown in transactions, home values continue to rise. This is a strong indicator of the area's ongoing demand and long-term investment potential for homeowners.
 
⬇️ SALE PRICE/LIST PRICE RATIO: 98.40%, up from 98.12% 📈
Homes are still selling close to list price, underscoring the need for buyers to come in with strong offers, especially on well-maintained and competitively priced homes.
 
💰 Price Analysis:
🏡 Homes Sold Under $499,999: 143 sales
🏘️ Mid-Range Market ($500,000–$999,999): 85 sales
💲 Luxury Market ($1M+): 16 sales
 
Are you ready to explore your real estate options or have questions about these statistics? Let’s discuss how these numbers can impact your buying or selling strategy!😄 🌟
July 1, 2025

✨June Market Trends: Your Guide to Local Real Estate

 
⬇️NEW LISTINGS IN JUNE: 354, down from 386🏡
New listings slowed slightly in June, with 354 homes hitting the market compared to 386 in May. This small decrease could reflect some sellers waiting for the right conditions or the right time to list.
 
⬆️ TOTAL ACTIVE HOMES: 719, up from 671 📊
The number of homes actively for sale grew to 719, up from 671 last month. This increase gives buyers more options, which can help reduce bidding wars and cool rapid price increases. A growing inventory is typically a healthy sign for buyers who have faced limited selection in recent months.
 
⬆️MONTHS SUPPLY OF INVENTORY: 2.86, up from 2.53 📉
The months supply of inventory rose to 2.86, up from 2.53 in May. This number measures how long it would take to sell all homes on the market at the current pace, and it's a key indicator of market balance. Though still considered a seller’s market, this upward trend suggests we may slowly be moving toward more neutral territory.
 
⬇️UNDER CONTRACT IN JUNE: 90, down from 108 📜
Only 90 homes went under contract in June, down from 108 the previous month. This drop could be a sign of buyer hesitation, perhaps due to interest rates, pricing, or simply more inventory to choose from. Fewer contracts may also point to buyers taking their time and being more selective.
 
⬇️TOTAL HOMES UNDER CONTRACT: 367, down from 387 🏠
The total number of homes under contract dipped to 367, compared to 387 last month. This softening suggests the pace of pending sales is slowing, which is common as summer progresses. Buyers and sellers may be adjusting their strategies as the market shifts toward more balance.
 
⬆️MEDIAN (HOMES SOLD) DAYS ON MARKET: 60, up from 55 ⏳
Homes are now spending a median of 60 days on the market, up from 55 last month. This increase gives buyers a little more breathing room when making decisions. Sellers should be prepared for slightly longer selling timelines and potentially more negotiation requests.
 
⬇️SOLD IN JUNE: 251, down from 265 🪧
There were 251 homes sold in June, a decrease from 265 in May. Even though sales dipped, the market is still active, and well-prepared homes continue to attract buyers.
 
⬇️MEDIAN SOLD PRICE $420,000, DOWN FROM $423,500 📉
The median sold price dropped slightly to $420,000, compared to $423,500 the month before. This minor adjustment shows that prices remain relatively stable but aren’t escalating like we’ve seen in previous years. Buyers may find small pricing advantages as inventory increases and competition softens.
 
⬇️ SALE PRICE/LIST PRICE RATIO: 98.12%, down from 98.25% 📈
The sale-to-list price ratio slipped to 98.12%, down from 98.25% in May. While homes are still selling very close to asking price, this slight decrease suggests some sellers are becoming more flexible. Buyers may have a bit more room for negotiation, especially on homes that have been on the market longer.
 
💰 Price Analysis:
🏡 Homes Sold Under $499,999: 162 sales
🏘️ Mid-Range Market ($500,000–$999,999): 73 sales
💲 Luxury Market ($1M+): 16 sales


Are you ready to explore your real estate options or have questions about these statistics? Let’s discuss how these numbers can impact your buying or selling strategy!😄 🌟
June 1, 2025

MAY Market Trends: Your Guide to Local Real Estate

✨MAY Market Trends: Your Guide to Local Real Estate 📈
 
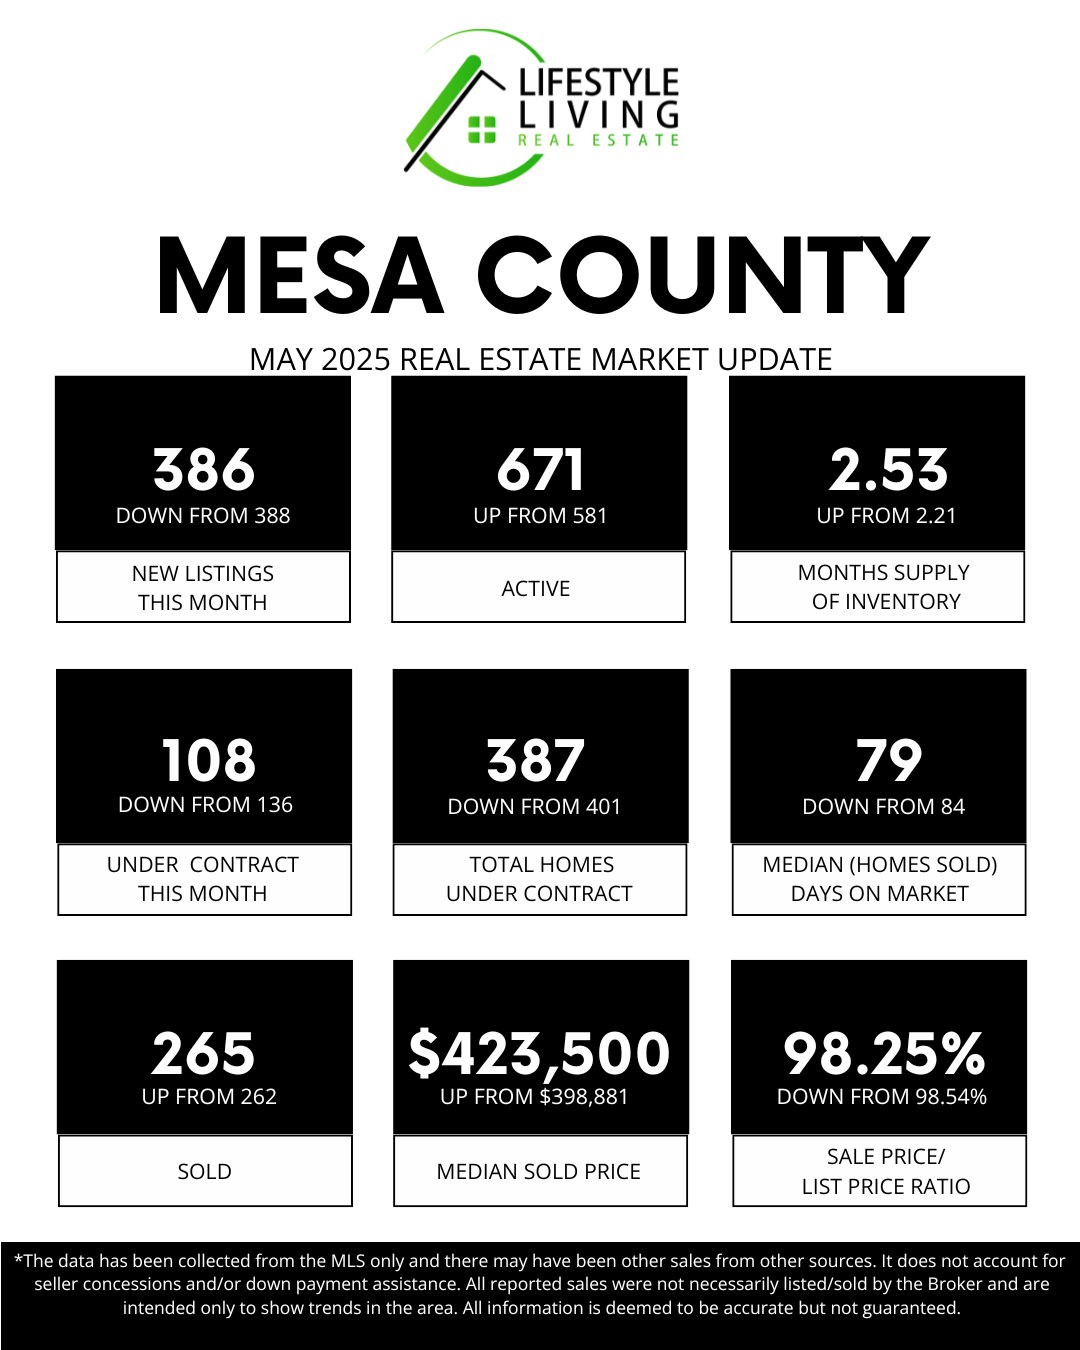
⬇️NEW LISTINGS IN MAY: 386, down from 388🏡
New listings held steady in May, with just two fewer homes coming on the market than in April. This signals consistency in seller activity heading into summer, but not a significant push of new inventory. Buyers are seeing a predictable flow of options rather than a surge.
 
⬆️ TOTAL ACTIVE HOMES: 671, up from 581 📊
​Active listings jumped significantly, adding 90 more homes to the market. This increase provides buyers with more choices and suggests that some momentum is building among sellers. A growing inventory could help balance the market as summer progresses.
 
⬆️MONTHS SUPPLY OF INVENTORY: 2.53, up from 2.21 📉
We saw an increase in supply this month, now sitting at 2.53 months. This is a positive sign for buyers, showing that inventory is improving. However, we’re still in a seller's market, so competitive pricing and preparation remain essential for sellers.
 
⬇️UNDER CONTRACT IN MAY: 108, down from 136 📜
​This is a sharper-than-expected drop for this time of year. May is typically a high-activity month, so seeing fewer homes go under contract suggests that elevated interest rates or affordability concerns may be weighing on buyers. While demand hasn't disappeared, the hesitation is noticeable—and it’s creating opportunities for serious buyers to negotiate without as much competition.
 
⬇️TOTAL HOMES UNDER CONTRACT: 387, down from 401 🏠
​Pending sales dropped again this month, continuing a modest downward trend. This could result in slightly fewer closings in early summer, though activity typically picks up mid-season.
 
⬇️MEDIAN (HOMES SOLD) DAYS ON MARKET: 79, down from 84 ⏳
ATTENTION SELLERS...Despite the dip in new contracts, homes are still moving faster than they were a month ago. The five-day drop in market time reflects demand for well-priced and well-presented homes.
 
⬆️SOLD IN MAY: 265, up from 262 🪧
​Closed sales rose slightly, but that slight increase doesn’t tell the whole story. We've seen more homes go under contract and then come back on the market, which signals that some deals are falling apart before closing, often due to inspection issues, financing problems, or the buyer's second thoughts. It's a reminder that getting under contract is only part of the process—solid preparation and realistic expectations are crucial to reaching the finish line.
 
⬇️ SALE PRICE/LIST PRICE RATIO: 98.25%, down from 98.54% 📈
​Though the change is small, it suggests buyers are finding more opportunities to negotiate, particularly on homes that require repairs, updates, or were initially priced above market expectations. For sellers, this means that setting a realistic price and presenting the home well are more important than ever to minimize concessions.
 
💰 Price Analysis:
🏡 Homes Sold Under $499,999: 179 sales
🏘️ Mid-Range Market ($500,000–$999,999): 74 sales
💲 Luxury Market ($1M+): 12 sales
 
Are you ready to explore your real estate options or have questions about these statistics? Let’s discuss how these numbers can impact your buying or selling strategy!😄 🌟
April 1, 2025

No Joke—The Market Is Heating Up!

Happy April! 🎉 Since today is April 1st, let’s start with a little fun—did you hear about the new law requiring all homes to come with a built-in slide from the second floor to the kitchen? 🏠🛝 No more morning coffee runs down the stairs! Okay, maybe that’s just an April Fools’ joke—but the real estate market right now is no joke!


March brought more new listings, rising home prices, and faster sales—all signs that the spring market is in full swing. If you’ve been thinking about making a move, now’s the time to pay attention.


April is also Fair Housing Month, a reminder that everyone deserves equal access to housing opportunities. The Fair Housing Act prohibits discrimination based on race, color, religion, sex, familial status, national origin, and disability. In Colorado, housing discrimination based on source of income, including Section 8 housing vouchers, is also prohibited.


This month, I’m breaking down the most common concessions buyers and sellers negotiate—so you know what to expect when making or accepting an offer. Plus, I’m excited to share a before-and-after staging transformation that proves just how much staging can impact a home sale!

Let’s dive in!


Your REALTOR®,
Julie


CLICK HERE TO VIEW APRIL'S NEWSLETTER

March 1, 2025

✨ February Market Trends: Your Guide to Local Real Estate

February 2025 Real Estate Market Report


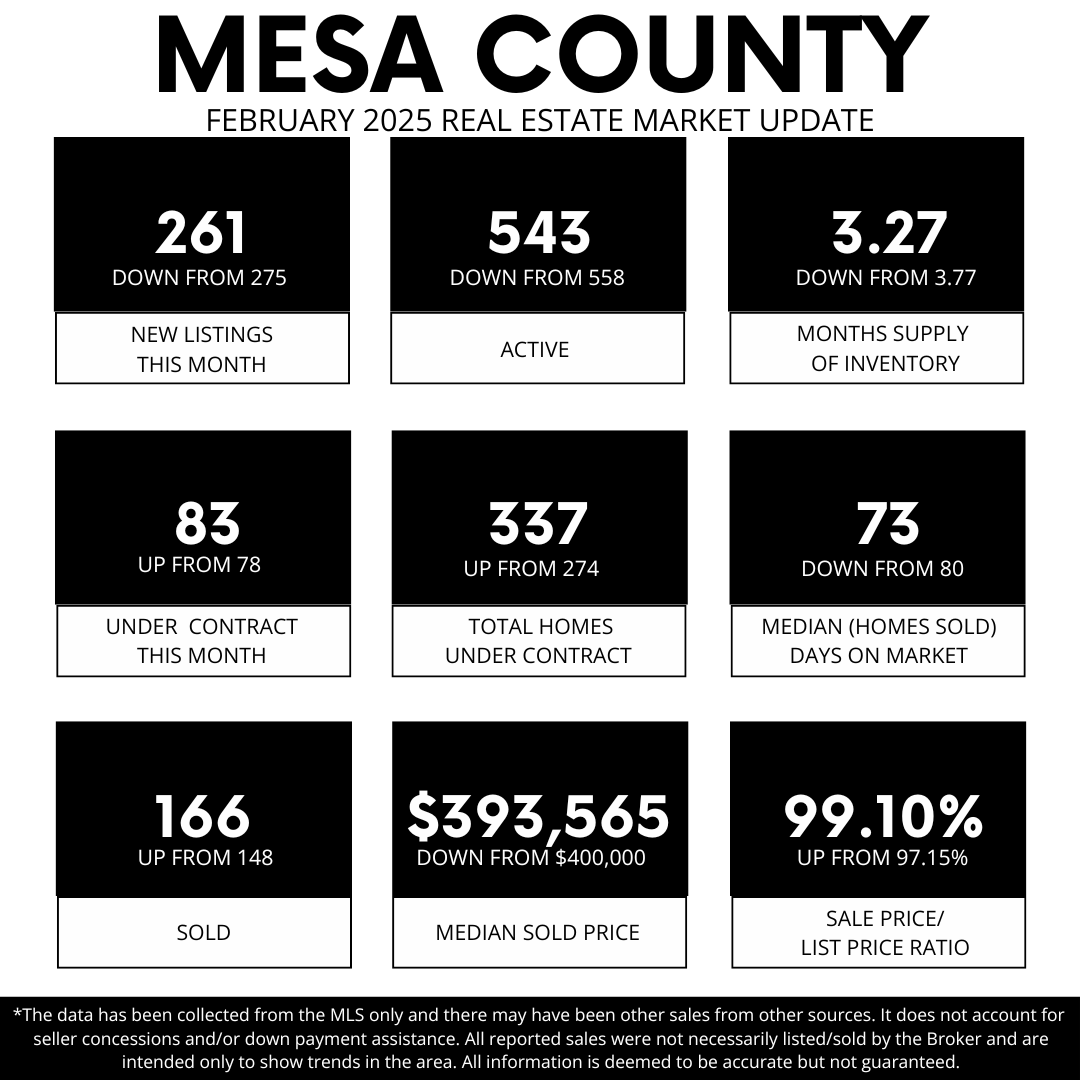
⬇️ NEW LISTINGS IN FEBRUARY: 261, down from 275 ❤️
Fewer homes were listed last month, signaling that sellers may still be waiting for the busy spring market. With inventory tightening, buyers may find fewer choices, making well-priced homes even more competitive.


⬇️TOTAL ACTIVE HOMES: 543, down from 558 🏡
The number of active listings continues to decline, reflecting a market where buyers are scooping up available homes faster than new ones are being listed. This can create a sense of urgency for buyers looking to lock in a home before the spring rush.


⬇️ MONTHS SUPPLY OF INVENTORY: 3.27, down from 3.77 📉
With inventory shrinking, the months of supply are also decreasing. A lower supply indicates a more competitive market for buyers, potentially leading to multiple-offer situations for well-presented homes.


⬆️ UNDER CONTRACT IN FEBRUARY: 83, up from 78 📜
More buyers secured homes last month, showing that demand remains strong despite limited inventory. This upward trend suggests that buyers are actively searching and making decisions sooner.


⬆️ TOTAL HOMES UNDER CONTRACT: 337, up from 274 🏠
This significant jump in pending sales highlights growing confidence in the market. Buyers are moving forward with purchases, anticipating more competition as spring approaches.


⬇️MEDIAN (HOMES SOLD) DAYS ON MARKET: 73, down from 80 🕒
Homes are selling slightly faster than last month, a sign that well-priced and well-prepared properties are attracting offers more quickly. This trend is expected to continue as buyer activity picks up.


⬆️SOLD IN FEBRUARY:  166, up from 148🪧
Sales activity increased, reinforcing the idea that buyers are getting off the sidelines and making moves before spring competition intensifies. More closed sales reflect steady demand in the market.


⬇️ MEDIAN SOLD PRICE: $393,564, down from $400,000 💵
The median sale price saw a slight dip, which could be due to more affordable homes selling or slight price adjustments to match market conditions. This presents an opportunity for buyers to secure a home before prices potentially rise again.


⬆️SALE PRICE/LIST PRICE RATIO: 99.10%, up from 97.15% 📈
Sellers are receiving offers closer to their asking price, showing that well-priced homes are attracting strong interest. This increase suggests that buyers are recognizing value and making competitive offers.


💰 Price Analysis:

🏡 Homes Sold Under $499,999: 121​ sales
The majority of sales were in this price range, showing that demand remains strong for affordable and mid-priced homes. Buyers looking in this range should be prepared for competition, as these homes continue to move quickly.

​🏘️ Mid-Range Market ($500,000–$999,999): 43 sales

This segment remains active, with buyers securing higher-end homes. Well-maintained properties with desirable features are attracting interest, especially as buyers seek more space and upgraded amenities.

💲 Luxury Market ($1M+): 2 sales
Luxury home sales were limited, reflecting a more selective market at higher price points. While this segment moves at a different pace, well-positioned luxury homes can still attract the right buyers looking for premium properties.

Are you ready to explore your real estate options or have questions about these statistics? Let’s discuss how these numbers can impact your buying or selling strategy!😄 🌟

Feb. 15, 2025

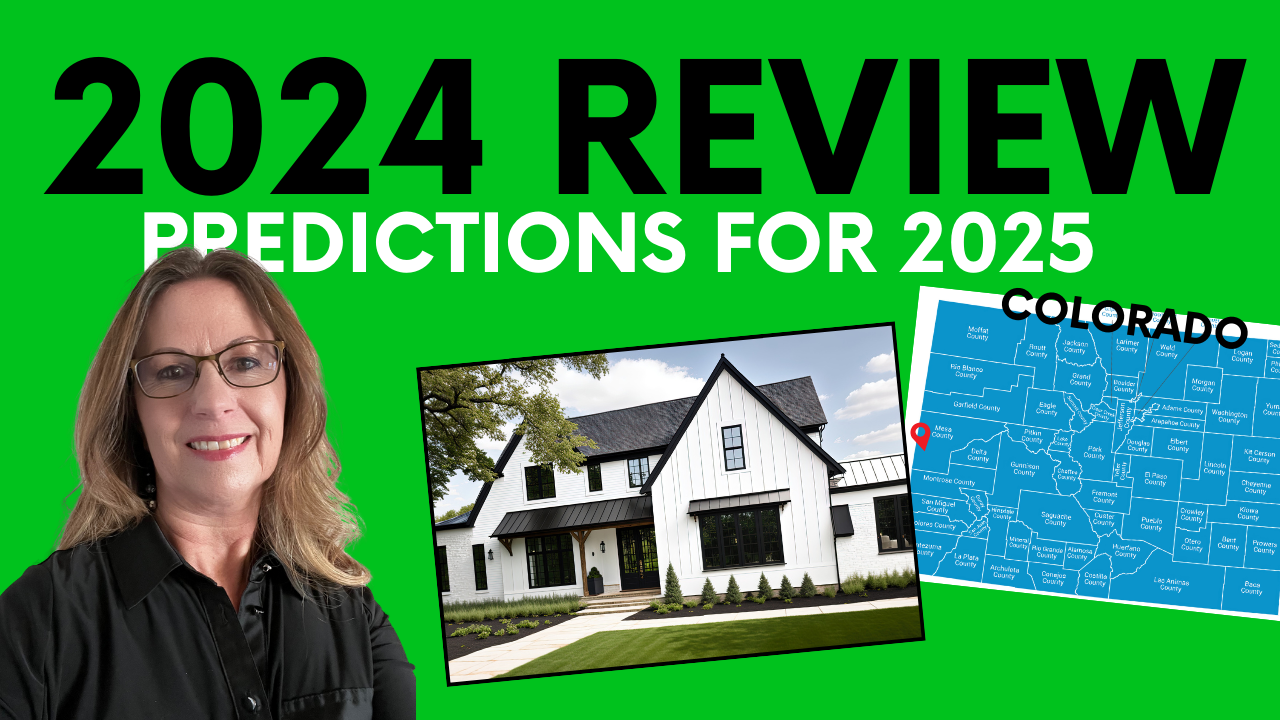
Mesa County Real Estate Market Update 2024 | Area Breakdown & 2025 Predictions


https://youtu.be/bzJNDrhBkzc

Jan. 1, 2025

New Year, New Beginnings: Your January Real Estate Update

🎉 Welcome to 2025! The start of a new year is the perfect opportunity to set fresh goals, reflect on what matters most, and take steps toward achieving your dreams. Whether you're dreaming of a cozy new home, seeking to sell your current property, or simply curious about the market, I'm here to help make your real estate journey as smooth as possible.


🏡 It's the perfect time for new beginnings! The real estate market tends to slow down a bit during the winter months, making it an ideal time to take a deep dive into your options, whether you're buying or selling. Inventory may be lower, but with the right guidance, we can uncover hidden gems that suit your needs.


📊 Looking back at Decembers numbers and 2024 as a whole? Active, under contract, and sold inventory levels, median home prices, and home prices are all key factors in the market this year. It's important to stay informed and make well-thought-out decisions. I’ll keep you updated with the latest trends, so you're always ahead of the game.


💬 Let’s Connect! I’m always here to chat and answer your questions about the market, whether you're a first-time homebuyer or an experienced investor. Let's work together to make 2025 your most exciting year yet!


🌱 New year, new opportunities—let's make it happen! Here’s to new adventures, fresh starts, and finding the perfect place to call home.


Wishing you a prosperous and joyful 2025! 🥂


Your REALTOR®,
Julie


READ THE ENTIRE NEWSLETTER BY CLICKING HERE

Posted in Market Updates
Jan. 1, 2025

Curious About Local Real Estate?

Receive the Latest Local Market Stats

Curious about local real estate? So are we! Every month we review trends in our real estate market and consider the number of homes on the market in each price tier, the amount of time particular homes have been listed for sale, specific neighborhood trends, the median price and square footage of each home sold and so much more. We’d love to invite you to do the same!

Get Local Market Reports Sent Directly to You

You can sign up here to receive your own market report, delivered as often as you like! It contains current information on pending, active and just sold properties so you can see actual homes in your neighborhood. You can review your area on a larger scale, as well, by refining your search to include properties across the city or county. As you notice price and size trends, please contact us for clarification or to have any questions answered.

We can definitely fill you in on details that are not listed on the report and help you determine the best home for you. If you are wondering if now is the time to sell, please try out our INSTANT home value tool. You’ll get an estimate on the value of your property in today’s market. Either way, we hope to hear from you soon as you get to know our neighborhoods and local real estate market better.

Posted in Market Updates